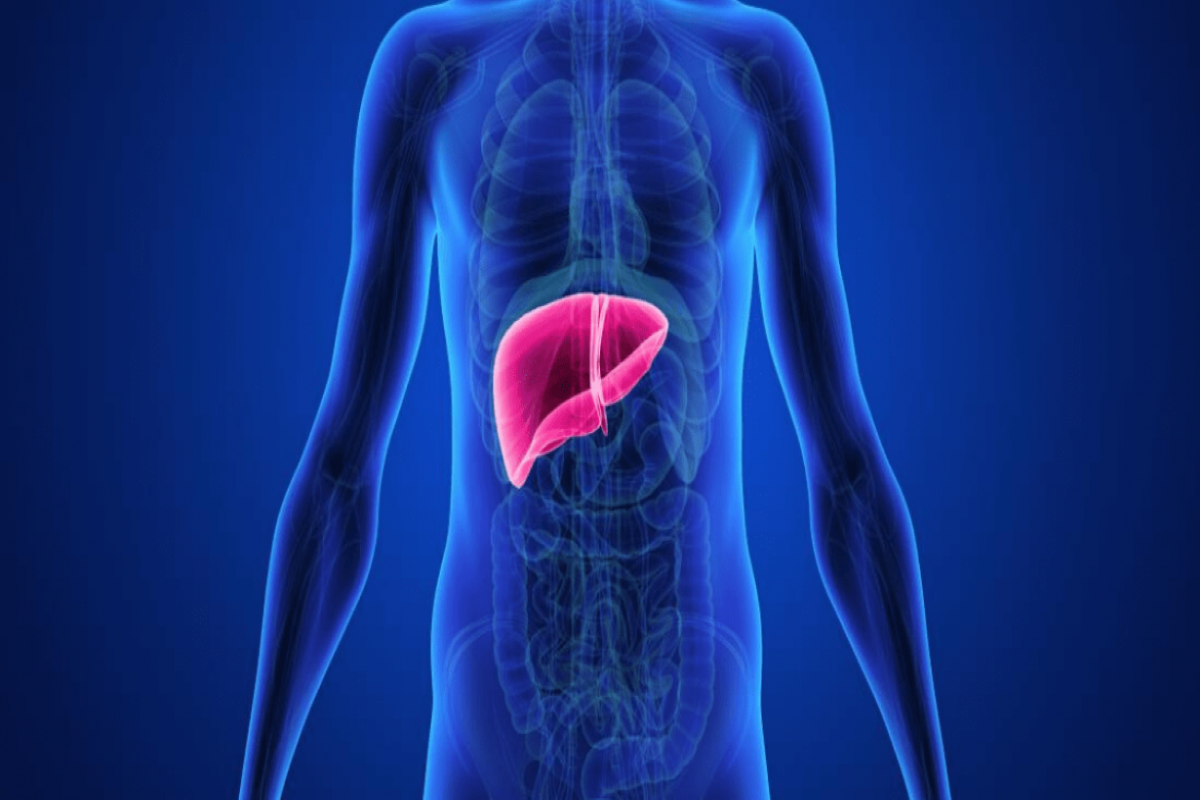
In a recent article published in The Lancet’s eBioMedicine open access journal, a team from Emory University and University Hospitals (UH) Cleveland shared results of a multi-site study that indicated patients with nonalcoholic fatty liver disease – also known as hepatic steatosis – were one-and-a-half times more likely to develop severe COVID-19.
The team obtained the results using a deep learning based hepatic fat assessment (DeHFt) pipeline it developed to provide automated measurements of liver fat from standard CT scans. Study collaborators included Case Western Reserve University, Wuhan University, the Atlanta Veterans Administration Medical Center and Guangdong Academy of Medical Sciences.
“We know that hepatic steatosis is a risk factor for COVID-19. Now we can use this pipeline to identify high-risk patients and based upon that clinicians can make better informed decisions about levels of care and the early use of therapeutics, such as antivirals,” says Gourav Modanwal, first author on the study and a researcher in the Wallace H. Coulter Department of Biomedical Engineering at Emory University School of Medicine and Georgia Institute of Technology College of Engineering.
The DeHFt process uses coronary artery calcium CT scans, which are commonly used to detect and measure calcium-containing plaque in a patient’s arteries. In addition to showing the heart, the images also include portions of the liver and spleen, so they provide an opportunity to evaluate liver fat. However, they have not been used historically to assess hepatic fat due to the difficulty of manually measuring regions of interest to clinicians at a higher magnification and resolution. The DeHFt pipeline can perform the job quickly and accurately, and it eliminates the inherent variability between CT scan readings among radiologists.
Deep learning, which is a type of artificial intelligence that imitates the way people gain knowledge, is the basis of the two-step DeHFt process. First, a segmentation model is trained to segment the liver and spleen using coronary artery calcium CT scans. Then CT attenuation – examination of the intensity of liver and spleen – is estimated using stacks of liver and spleen slices visible in 3D. Lower liver intensities reflect more fat infiltration, while the spleen serves as a control to compare the liver-to-spleen ratio.
“This is a very exciting and translationally relevant finding. Our study suggests that machine learning based on routine CT scans can help in accurate quantification of liver fat, which has implications that extend beyond COVID-19 severity assessment,” says Anant Madabhushi, the study’s senior author and a professor in the Wallace H. Coulter Department of Biomedical Engineering at Emory School of Medicine and Georgia Institute of Technology College of Engineering.
Hepatic attenuation on CT scans is a surrogate marker for cardiometabolic risk, including type 2 diabetes and its progression. “This novel pipeline provides an important avenue for CT-based analysis of adiposity and metabolic risk that is scalable for population-level imaging and can be used for risk stratification for cardiometabolic disease,” says study co-author Sadeer Al-Kindi, MD, director of the cardiovascular phenomics core and co-director of the Vascular Metabolic Center at the UH Harrington Heart & Vascular Institute. “We are currently working on translating this and validating it in various large cohorts for risk prediction.”
Modanwal says the DeHFt pipeline offers promise for reliable, reproducible liver fat measurements, providing an integrated cardiometabolic and COVID-19 risk tool.
“This is a unique way to look at whether or not a patient has fatty liver disease using CT scans,” he says. “We can apply the pipeline to millions of cases rather than relying on time-consuming manual examination of scans.”

