Donna Troka admits to being terrified last spring when bringing a new technology into her classroom, but it's a fear she hopes more faculty will be willing to face.
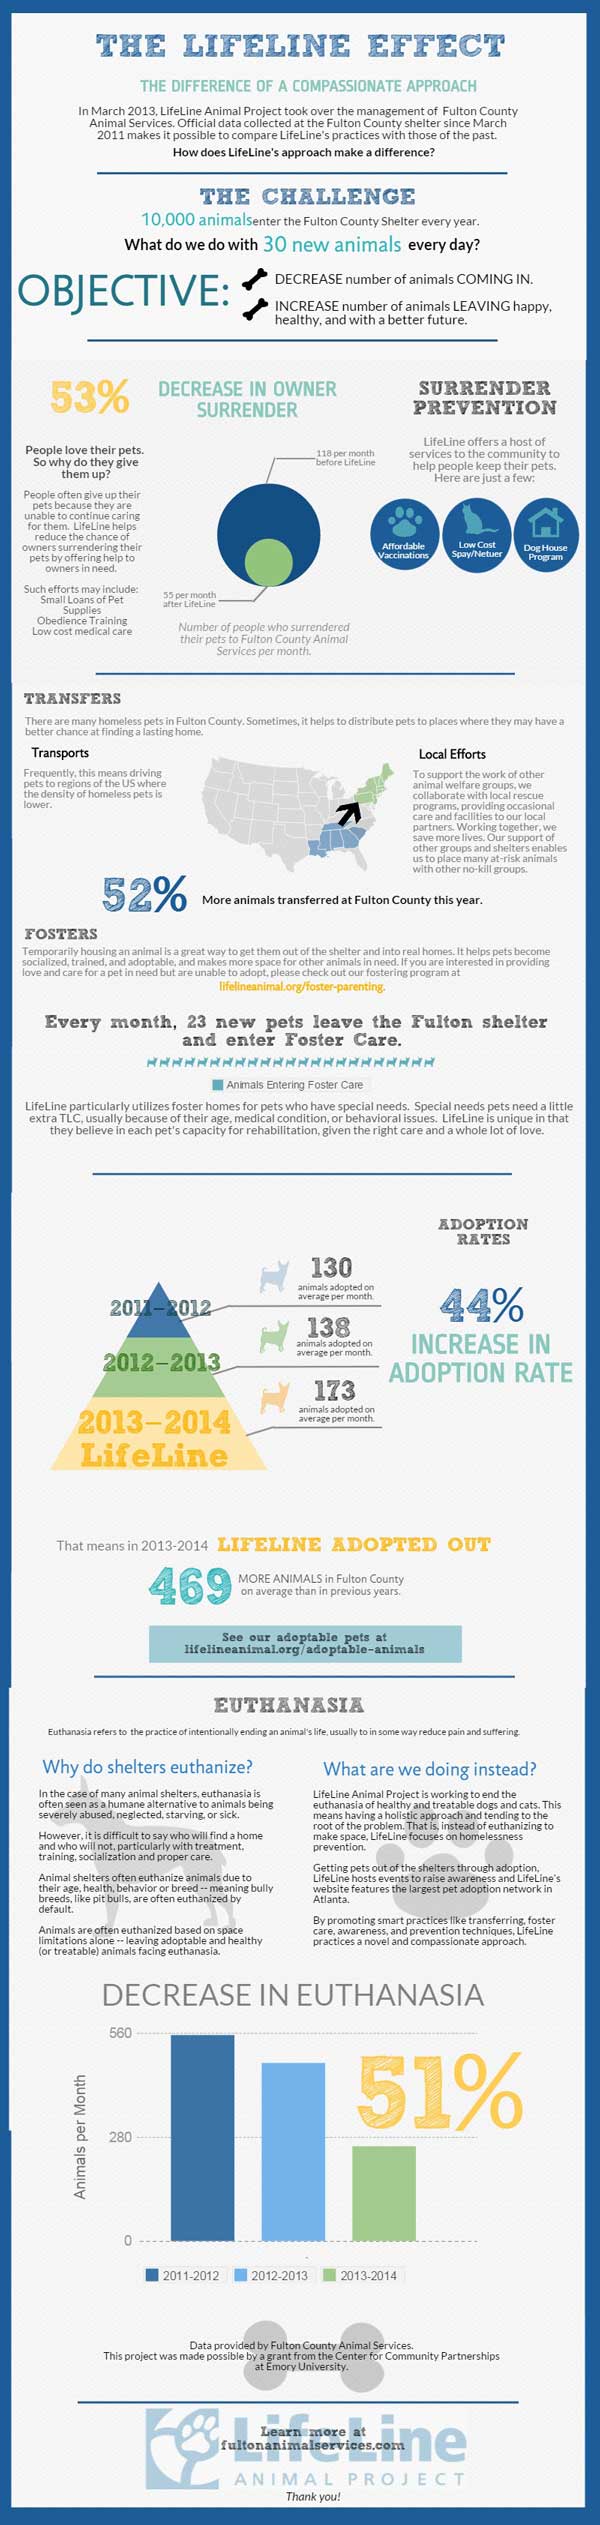
Finished projects: These infographics for Lifeline Animal Project were made by Carly Landa and Sarah MacDougall, students in Donna Troka’s IDS 490R course in Spring 2014. Landa and MacDougall graduated in May 2014 from Emory College. Click image to view larger.
As associate director of Emory's Center for Faculty Development and Excellence and adjunct professor in the Institute of Liberal Arts (ILA), Troka said, "If I'm going to help faculty, I need to also do it myself, which is terrifying because it means relinquishing power.
"If you're going to bring in new things, you can feel like you're stumbling alongside [your students]. And that's really scary at times."
The latest challenge Troka has taken on is using infographics in her class, an American studies special topics course, "The Dividing Line: Dogs, Identity and Community."
She and Alan Pike, a PhD candidate in the ILA who works in the Emory Center for Digital Scholarship, presented their experience at an October Digital Pedagogy meet-up. The group's members are from institutions of higher education across the metro area.
Pike gave Troka's class a workshop on what infographics are, how data visualization works and how to use the program he and Troka chose for creating the infographics.
"[Infographics] are usually big, long vertical documents that use images and text to convey some complex information," said Pike. "The information is contained in one document. Most of the time, people encounter these on social media. It is a linear narrative and for students, we ask them to make an argument like they do in a written essay.
"Students all know about them but have no sense that they can make one," Pike added.
Troka's students created infographics for the course's community partner, Lifeline Animal Project.
"We wanted to make accessible the impact they had had in the community," she said.
Pike and Troka chose to have students create the graphics using Piktochart, a free program with a pro or premium option. Piktochart is "really easy to use," Pike noted.
"The software is quite simple. It's free. If you can do basic word processing, you can figure this out," he said. "If you've ever built a website in Wordpress, this is much easier than that."
Troka liked that "you're not starting with a blank page. They have hundreds of templates." She says she was lucky enough to get a grant from the Center for Community Partnerships at Emory to buy four-month Piktochart subscriptions for her students and expand their template choices.
"Part of why I chose [the infographic format] was that it motivates creativity in students," Troka added.
Working alongside students
In Pike's workshop, he said, "We talked about 'when you create something like this, you have to keep your audience in mind.' The same kinds of questions students consider in writing courses are the same ones in creating infographics."
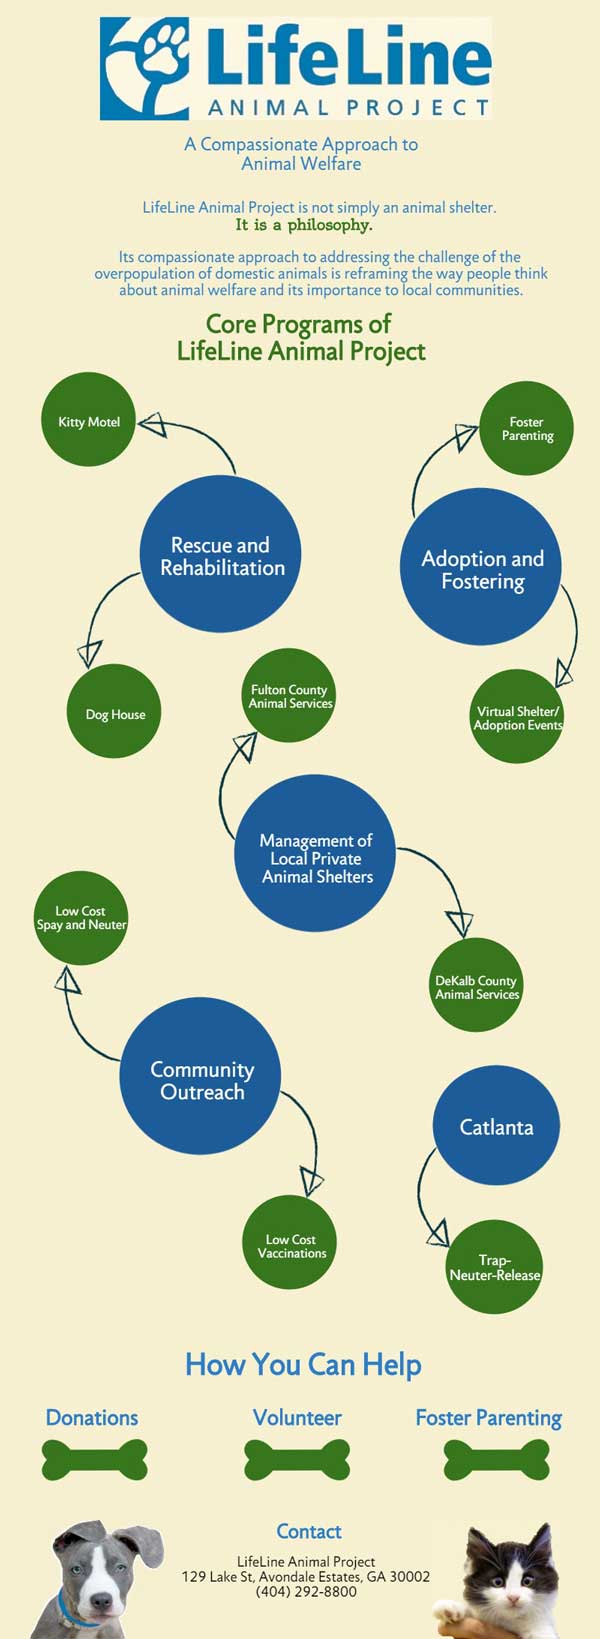
Click image to view larger.
The students had "this big, giant spreadsheet full of data and were trying to figure out how to make that spreadsheet data accessible for Lifeline's clientele, how to make it useful for the website and the class blog," Pike explained.
Infographics must be designed to be read quickly, Troka noted. "We had to talk about how long are they (the audience) going to be looking at this. The information has to be quick bits. We talked a lot about the form and how the form required a certain type of writing," she said.
"It was important to me that they be able to tell the story and tell it clearly, fairly concisely and that it was attractive enough for the community — that the story was 'pretty' to get people to look at it," Troka said.
Troka worked alongside her students because she felt she should do the assignment. She said it was hard and took a long time. "Sometimes we'd meet for hours, like three hours, to work out what should be done.
"What I learned is you can't just ask people to do it," Troka said, noting that instructors need to either know the program well or have help from ECDS to assist students. She also recommended having students complete a practice assignment.
"I think I have a lot of assumptions about my students and their level of technology because we think of these Millennials who come out of the womb with a cell phone in their hand. But they don't always know how to do some of this stuff," she said.
The project would not have been possible without help from ECDS and the CFCP teaching grant, Troka said.
"I'm lucky that Emory offers those things to me," she said.