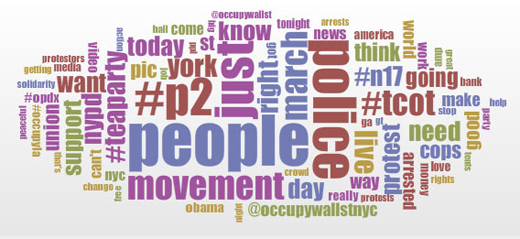
Ten million tweets about Occupy Wall Street are now collectively available from Emory.
Emory Libraries' Digital Scholarship Commons (DiSC) has collected more than 10 million tweets about the Occupy Wall Street movement and shaped them into visualizations, like word clouds and heat maps.
DiSC scholars and staff unveiled the Tweeting #OWS project, which began in October 2011, on the first anniversary of the street demonstrations earlier this week.
"Twitter does not allow users to go back and download large quantities of tweets; it does archive but it does not allow free, public access to that archive," explains Stewart Varner, DiSC coordinator. "The public life of a Tweets is finite; after a while it is not possible to retrieve them."
The only way to have a collection, he says, is to do what Emory Libraries' software engineering manager Scott Turnbull did and write a piece of software that "listens" to Twitter and copies down everything that fits a particular description.
"I created an open source application called 'Twap' which is short for Twitter Trap." It can be used by anyone and captures tweets by the specified hashtags," Turnbull says.
The project was sparked by an online musing "wondering if anyone was saving these tweets on Occupy Wall Street," says Varner. And it was influenced by social media's role in Occupy Wall Street, which "captured a lot of people's imagination," he notes.
The purpose was to use large data sets for social media, to help users find where something happened and why something happened — "to create the most useful collection available to scholars," Varner says.
The archive's visualizations were created by Moya Bailey, Sarita Alami and Katie Rawson, the three graduate fellows in DiSC.
Dealing with 10 million tweets was "a pretty massive undertaking," says Alami.
A portrait of Occupy Wall Street
"Reading through these tweets was a fascinating snapshot of the social media activity around and within Occupy Wall Street," Alami says, "and harvesting them digitally allowed us figure out what subjects and ideas popped up most regularly." She posted a blog entry on creating the heat map.
"Looking at the animated heat map of New York City, which I created by plotting the latitude, longitude and date of each tweet, produces a fascinating portrait of the Occupy movement," Alami explains. "For me, that visual of a pulsing hub of activity [at New York's Zuccotti Park] that doesn't wane until police force protesters out is very powerful."
She points out the surge of Twitter activity on the Brooklyn Bridge after police forcibly clear Zuccotti Park in November 2011. "These people on the bridge are in many ways at the center of the movement, and they're tweeting, and everyone around the world is retweeting that information, so there is a huge spike in overall Occupy tweets."
Looking at the tweets from the one-year anniversary of the movement, Varner says the conversation is still going, though not nearly as much as last year. "It's trending down but we're wondering if the one-year anniversary will make a blip up," he says.
Legal, ethical, privacy and copyright concerns constrain the distribution of the collected tweets. "You can't actually repost the tweets but you can use them as data," Varner notes. The Library of Congress is archiving all of Twitter but there is no public access to that archive at this time.
He says under discussion is a hackathon — inviting people in to work on the data and see what they discover and do with it.
As DiSC solutions analyst Jay Varner explains, the future of Emory's project will be determined by what happens in the Occupy Wall Street movement itself.
"We want to advertise the fact that we have this data," he says.
Adds Bailey, "We encourage people to come to DiSC to engage these features."

